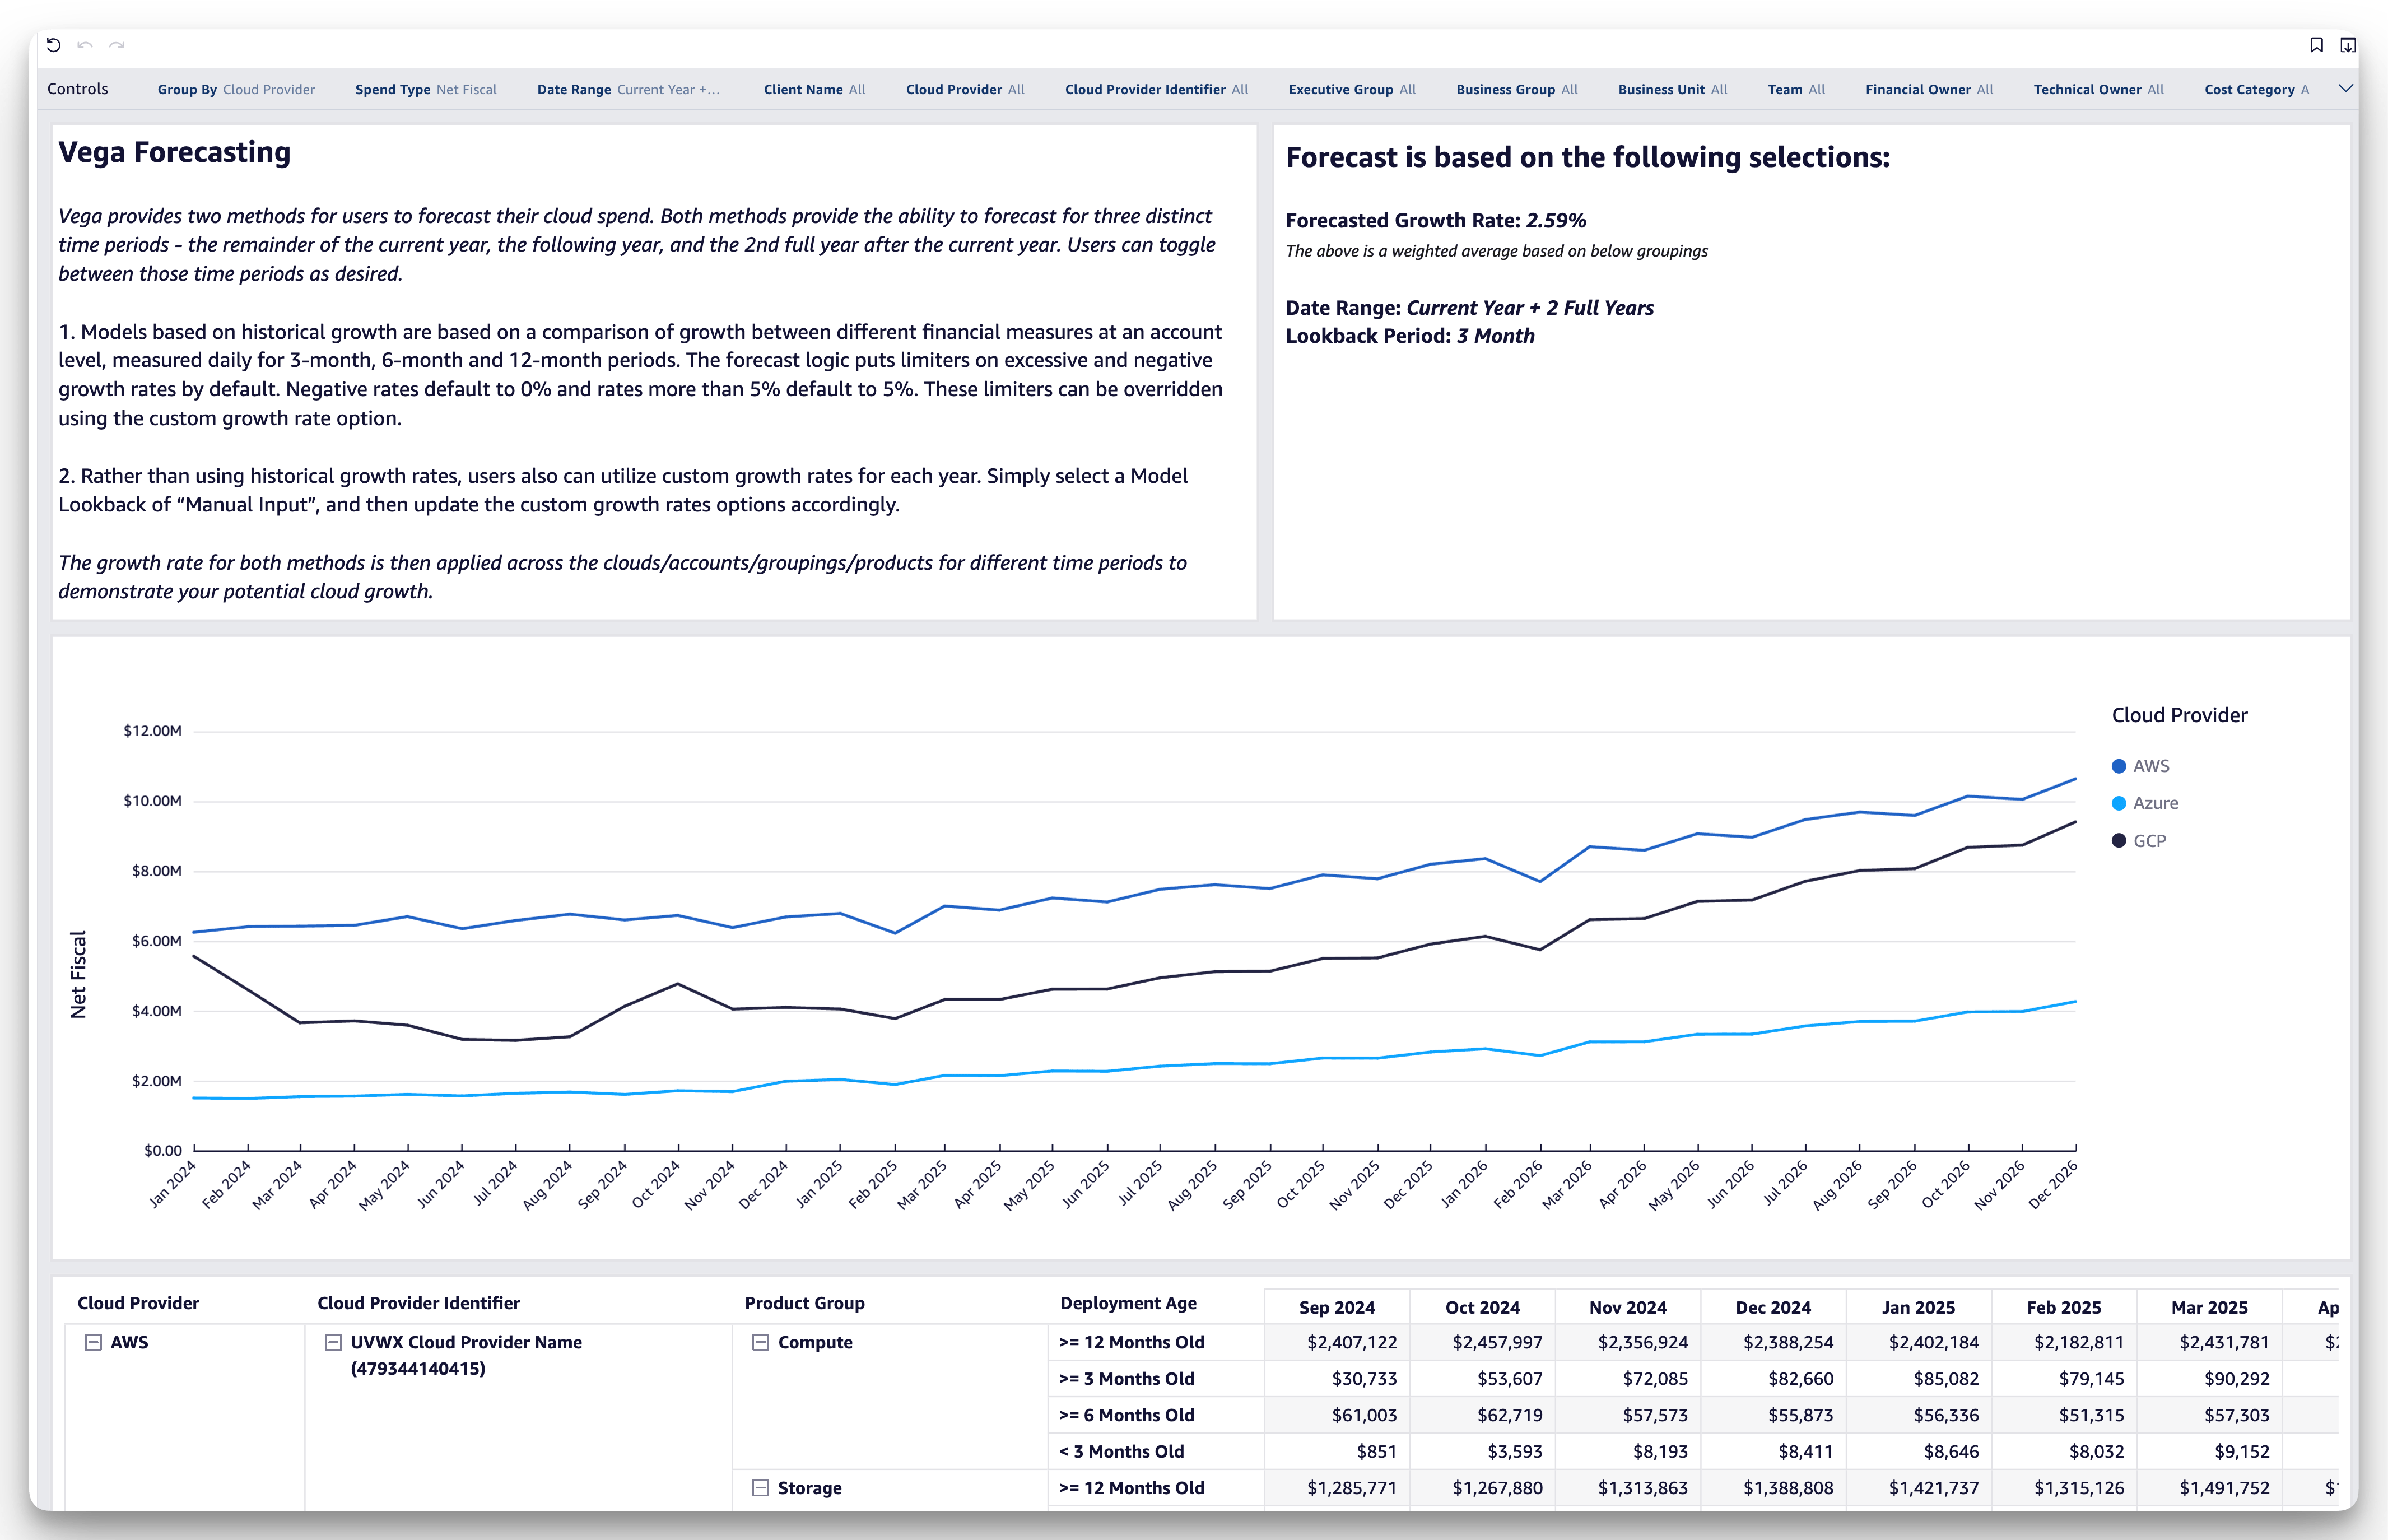
Forecasting Dashboard
Introduction
The Forecasting Dashboard empowers FinOps practitioners, executives, and engineers to anticipate future cloud spending with confidence. By combining historical growth rates, custom inputs, and granular filtering, this dashboard enables precise cost planning, helping teams stay proactive about budget control and resource allocation.
Vega Forecasting provides two key methods for projecting cloud spend:
-
Historical Growth Models: Analyze growth trends based on a comparison of daily financial measures across 3-month, 6-month, and 12-month periods. By default, growth rates are limited to a range of 0% to 5% to prevent excessive or unrealistic forecasts. Users can override these default settings by applying custom growth rate options.
-
Custom Growth Rate Models: Use "Manual Input" to define growth percentages for each forecast period, providing flexibility for unique scenarios or business strategies.
Users can forecast across three distinct time periods:
- The remainder of the current year.
- The following year.
- The second full year after the current year.
Key Dashboard Features

Information on this Dashboard
- Forecasted Growth Rate: Weighted growth rates calculated from historical data or user-defined inputs.
- Customizable Timeframes: Projections are available for three distinct time periods, allowing users to toggle between them dynamically.
- Deployment Age Segmentation: Classifies resources based on how long they’ve been active, using billing and metric data. Users can segment resources into time periods such as:
- < 3 Months: Newly deployed resources.
- 3-6 Months: Mid-stage resources.
- 12 Months and Older: Long-term deployed resources.
- Detailed Spend Breakdown: Provides insights by product group, cloud provider, and deployment age.
- Advanced Filtering: Refine data by dimensions such as cloud provider, business unit, or product categories.
- Interactive Controls: Adjust growth rates, groupings, and date ranges dynamically to simulate different forecast scenarios.
How this Enables Your Team
- Strategic Budget Planning: Forecast future spending with accuracy to align budgets with organizational goals.
- Scenario Flexibility: Analyze both historical growth and manual inputs for a comprehensive understanding of future spend.
- Proactive Cost Management: Use deployment age segmentation to identify trends, optimize resource lifecycles, and prepare mitigation strategies in advance.
Dashboard Sections
Forecast Controls

Information on this Section
- Growth Input Controls: Specify growth percentages for the current year and subsequent years using the "Manual Input" mode.
- Historical Growth Models: Default settings analyze daily financial measures using a 3-month, 6-month, or 12-month lookback.
- Deployment Age Context: Combine growth models with deployment age data to track how newly deployed or older resources impact forecasted spend.
- Model Limiters: Default limits cap negative growth rates at 0% and excessive rates at 5%. These can be overridden via custom growth options.
How this Enables Your Team
- Tailored Forecasts: Customize growth assumptions to reflect organizational strategies.
- Scenario Planning: Combine growth rates and deployment age to create actionable insights.
- Dynamic Analysis: Quickly adjust settings to test different growth scenarios and their impact on budgets.
Forecast Details Section

Information on this Section
- Forecasted Spend by Cloud Provider: A line graph illustrates projected spend trends for AWS, Azure, and GCP over time.
- Detailed Breakdown Table: Includes projected spend by cloud provider, product group (e.g., compute, storage), and deployment age.
- Deployment Age Insights: Classify resources into buckets by their age:
- Resources less than 3 months old provide insights into the cost impact of new deployments.
- Resources between 3-6 months reveal trends for maturing workloads.
- Resources older than 12 months allow users to analyze established, long-running resources for optimization opportunities.
How this Enables Your Team
- Visualize Spending Trends: Understand which providers and resource groups are driving costs over time.
- Resource Lifecycle Insights: Segment spend by resource age to identify patterns and opportunities for optimization, like shifting older resources to lower-cost options or ensuring proper utilization.
- Detailed Analysis: Use the table breakdown to track spend by categories, such as compute or storage, along with resource deployment age.
Customizing the Forecast
The Forecasting Dashboard is highly customizable to suit diverse organizational needs:
- Growth Adjustments: Modify historical growth models or define custom growth percentages to refine forecasts.
- Deployment Age Filters: Segment resources by their deployment age to gain insights into cost impacts across lifecycles.
- Interactive Visuals: Analyze spend projections dynamically to identify opportunities for cost control and optimization.
Frequently Asked Questions (FAQ)
What is Deployment Age?
Deployment Age is a segmentation metric that classifies resources based on how long they’ve been active, using billing and metric data. It allows users to group resources into time periods such as less than 3 months, 3-6 months, or 12 months and older.
Why is Deployment Age important?
Deployment Age provides insights into the lifecycle of resources, helping users understand cost impacts of new, maturing, and long-running resources. It enables targeted optimization strategies for each stage.
How do I use Deployment Age in forecasts?
Use the filters in the controls section to segment forecasts by deployment age, allowing for deeper analysis of spend trends and lifecycle impacts.
What do the growth percentages mean?
Growth percentages reflect expected changes in cloud spending. Users can rely on historical averages or input custom growth rates to tailor the forecast.
What does the model lookback period do?
The model lookback period determines how far back the system analyzes financial data to calculate growth trends. Options include 3-month, 6-month, and 12-month periods.