Executive KPIs
Introduction
The Executive KPIs Dashboard is a comprehensive collection of metrics designed to provide leadership and FinOps practitioners with insights into cloud cost efficiency, resource usage, and budget adherence. This dashboard is divided into several key sections, including savings analysis, virtual machine and storage KPIs, trend insights, and budget tracking, offering a holistic view of cloud financial performance.
Executive KPIs Overview
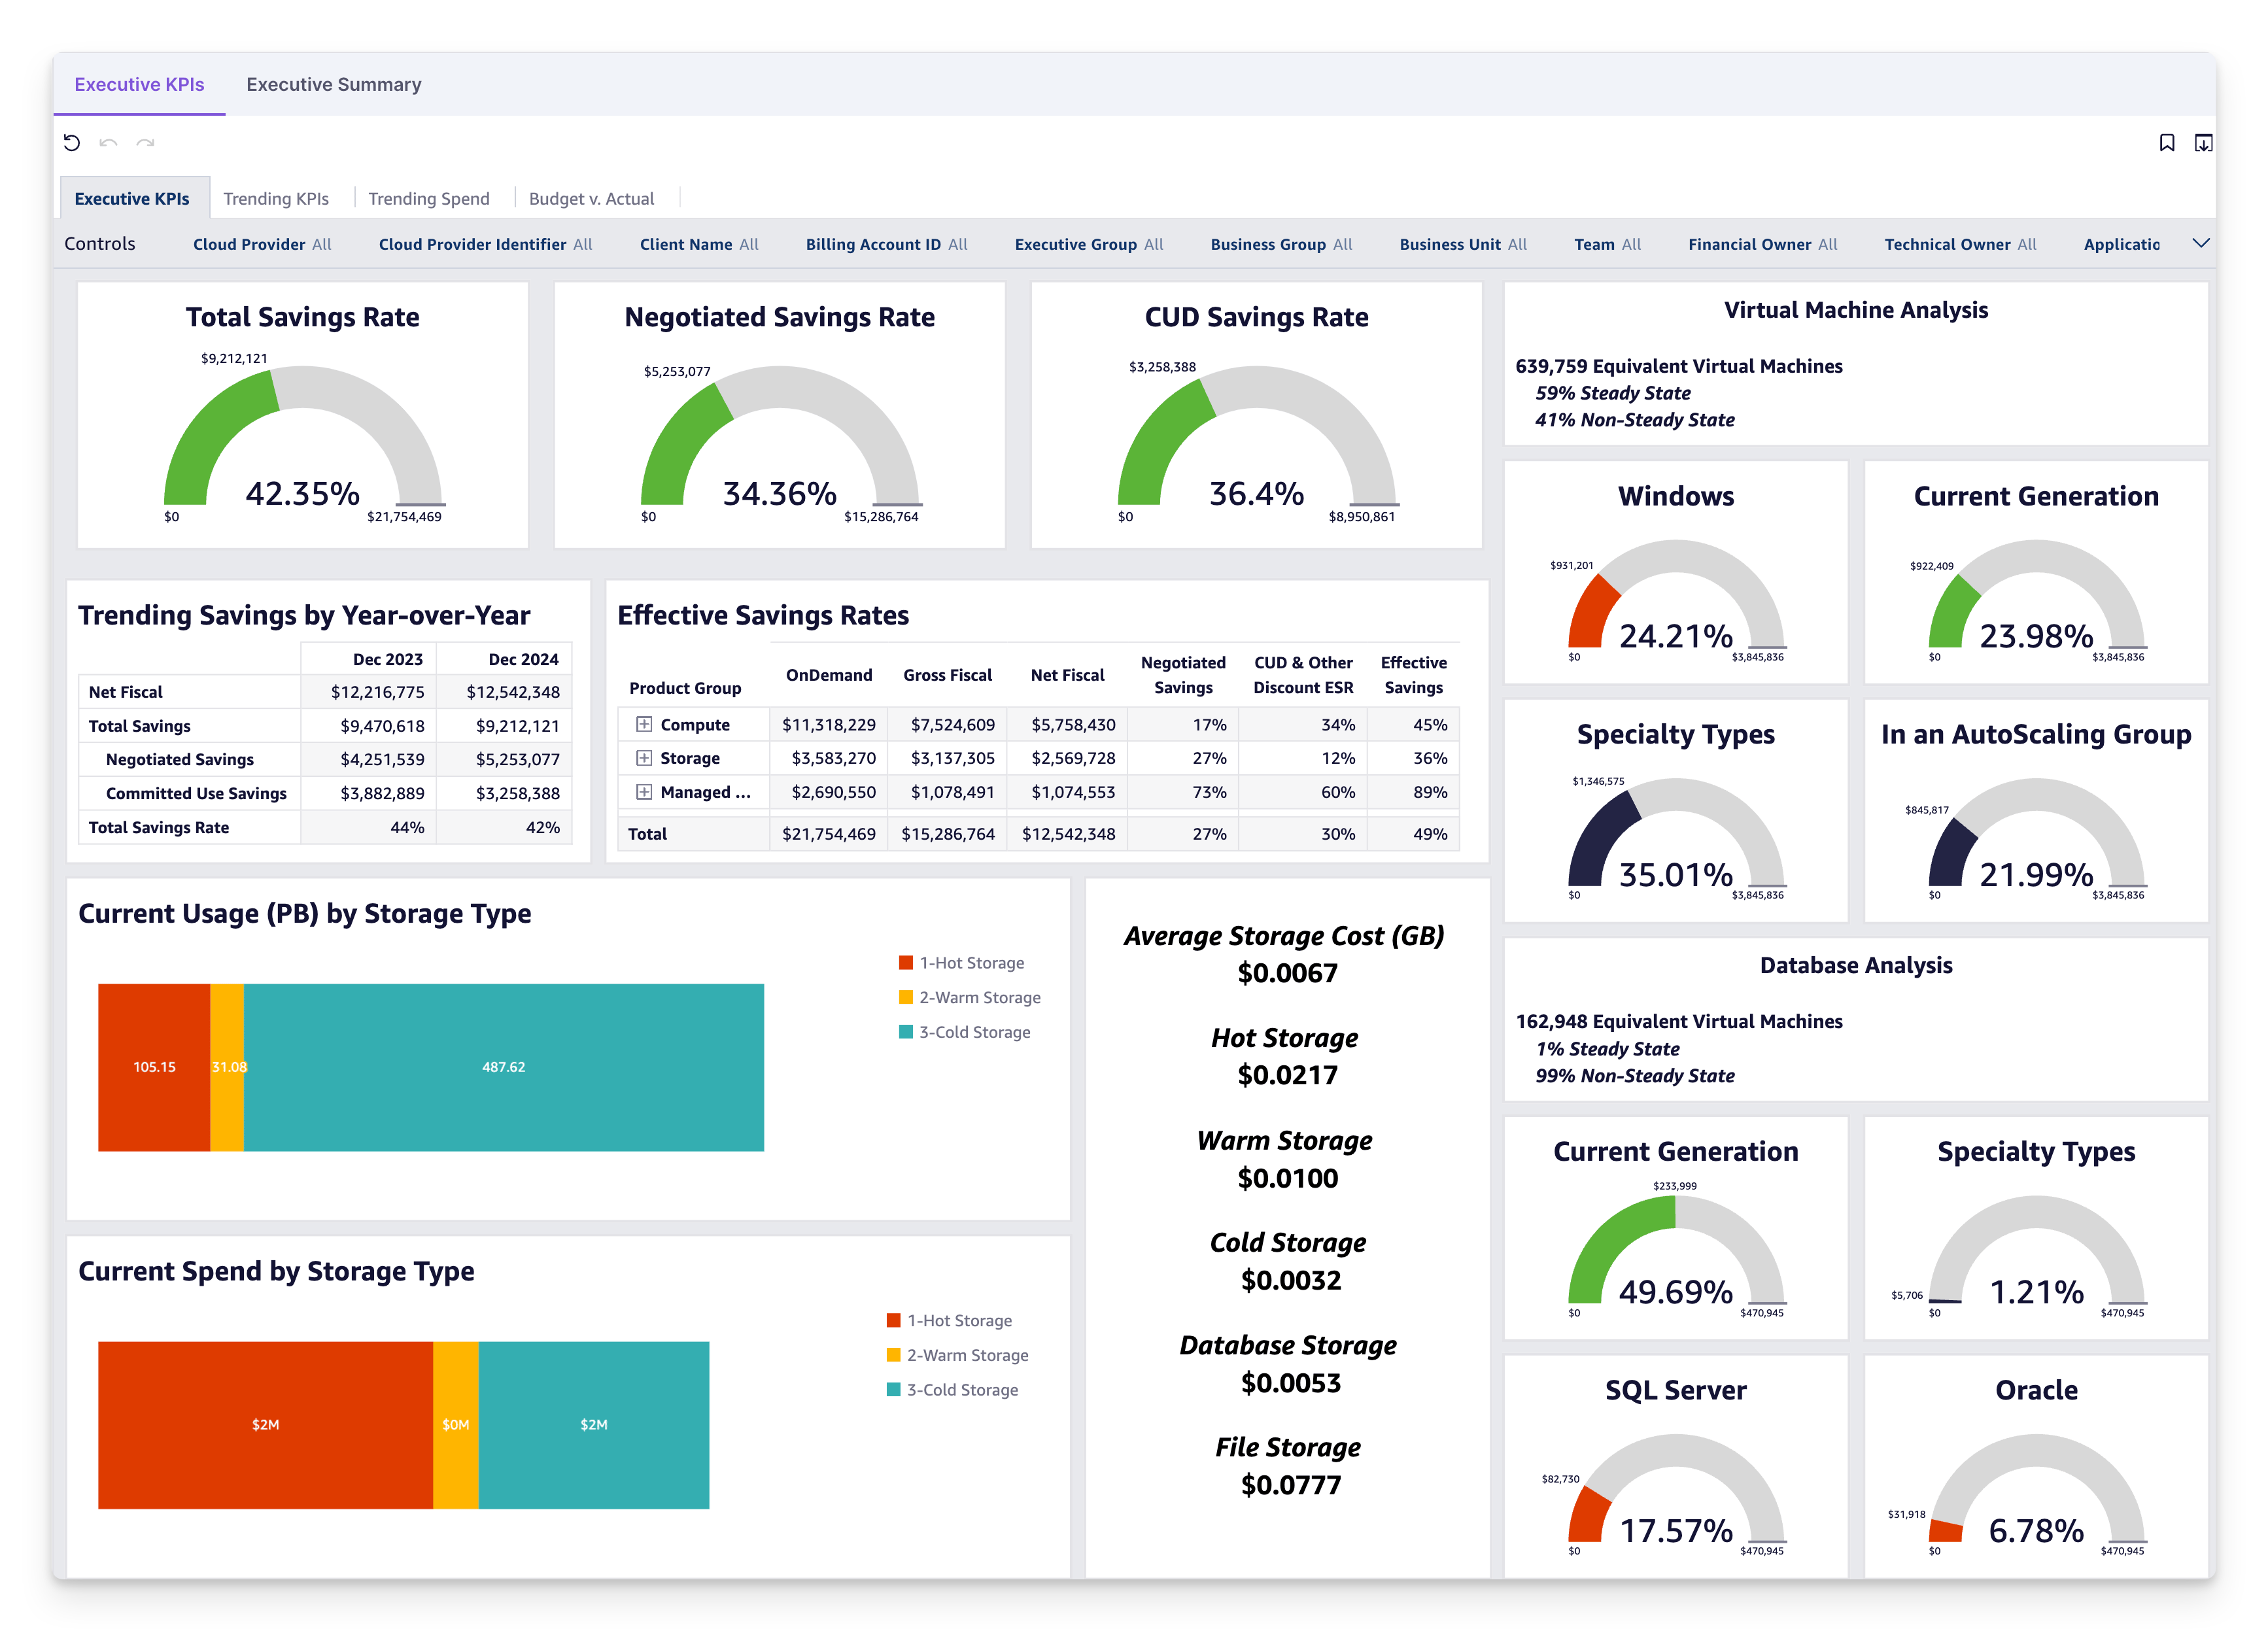
The Executive KPIs Overview provides high-level metrics to assess your organization's cloud cost efficiency and savings performance. This section is designed to give leadership and FinOps practitioners actionable insights into savings, resource usage, and cost optimization opportunities.

Information on this Dashboard
Effective Savings Rates
- Total Savings Rate: The overall percentage of cost savings achieved compared to on-demand (list) pricing. This is useful because it offers a benchmark to understand the efficiency of your overall cloud cost-saving strategies, combining all applied savings mechanisms.
- Negotiated Savings Rate: The percentage of savings achieved through enterprise agreements, private pricing, or other custom-negotiated terms with cloud providers. This is useful because it highlights the impact of custom pricing agreements and ensures you’re leveraging negotiated terms effectively.
- Committed Use Discount (CUD) Savings Rate: The percentage of savings realized through committed-use discounts, such as reserved instances or savings plans. This is useful because it evaluates how effectively purchased commitments align with actual usage, helping to identify under- or over-utilization of these discounts.
Virtual Machine Metrics
- Steady-State and Non-Steady-State VM Usage: Breaks down workloads into steady-state (always running) and non-steady-state (intermittently powered on/off) instances. This is useful because it helps identify opportunities to optimize non-production or ephemeral workloads for cost efficiency.
- Current Generation Adoption: The percentage of VMs running on the latest instance types available. This is useful because newer instance types typically offer better performance and cost efficiency, making it an indicator of modernization.
- Specialty Types and Auto-Scaling Groups: Tracks the use of specialized VM configurations and auto-scaling mechanisms. This is useful because it helps assess cloud-native design practices and potential risks related to specialized instance availability.
Storage Metrics
- Usage by Tier: The distribution of data across storage performance tiers (hot, warm, and cold). This is useful because it helps optimize storage costs by identifying data that can be moved to lower-cost tiers without affecting performance.
- Storage Costs and Average Cost per GB: Benchmarks cost efficiency by comparing the average cost per GB across storage tiers and types (e.g., database, file storage, archival). This is useful because it provides a clear metric to evaluate storage efficiency and uncover opportunities for cost reduction.
Trending Savings by Month
- What It Is: A breakdown of monthly savings trends, including negotiated savings, committed use savings, and net fiscal impact.
- Why It's Useful: This is useful because it shows how savings programs affect your total cloud spend over time, enabling you to evaluate the performance of negotiated and committed-use agreements month by month.
How this Enables Your Team
- Monitor Efficiency: Quickly gauge the effectiveness of savings programs and discounts, ensuring alignment with organizational goals.
- Guide Optimization: Identify areas for improvement, such as underutilized negotiated terms or outdated virtual machines.
- Support Decision-Making: Use clear metrics to inform strategic purchasing, resource allocation, and modernization efforts.
Trending Spend

Information on this Dashboard
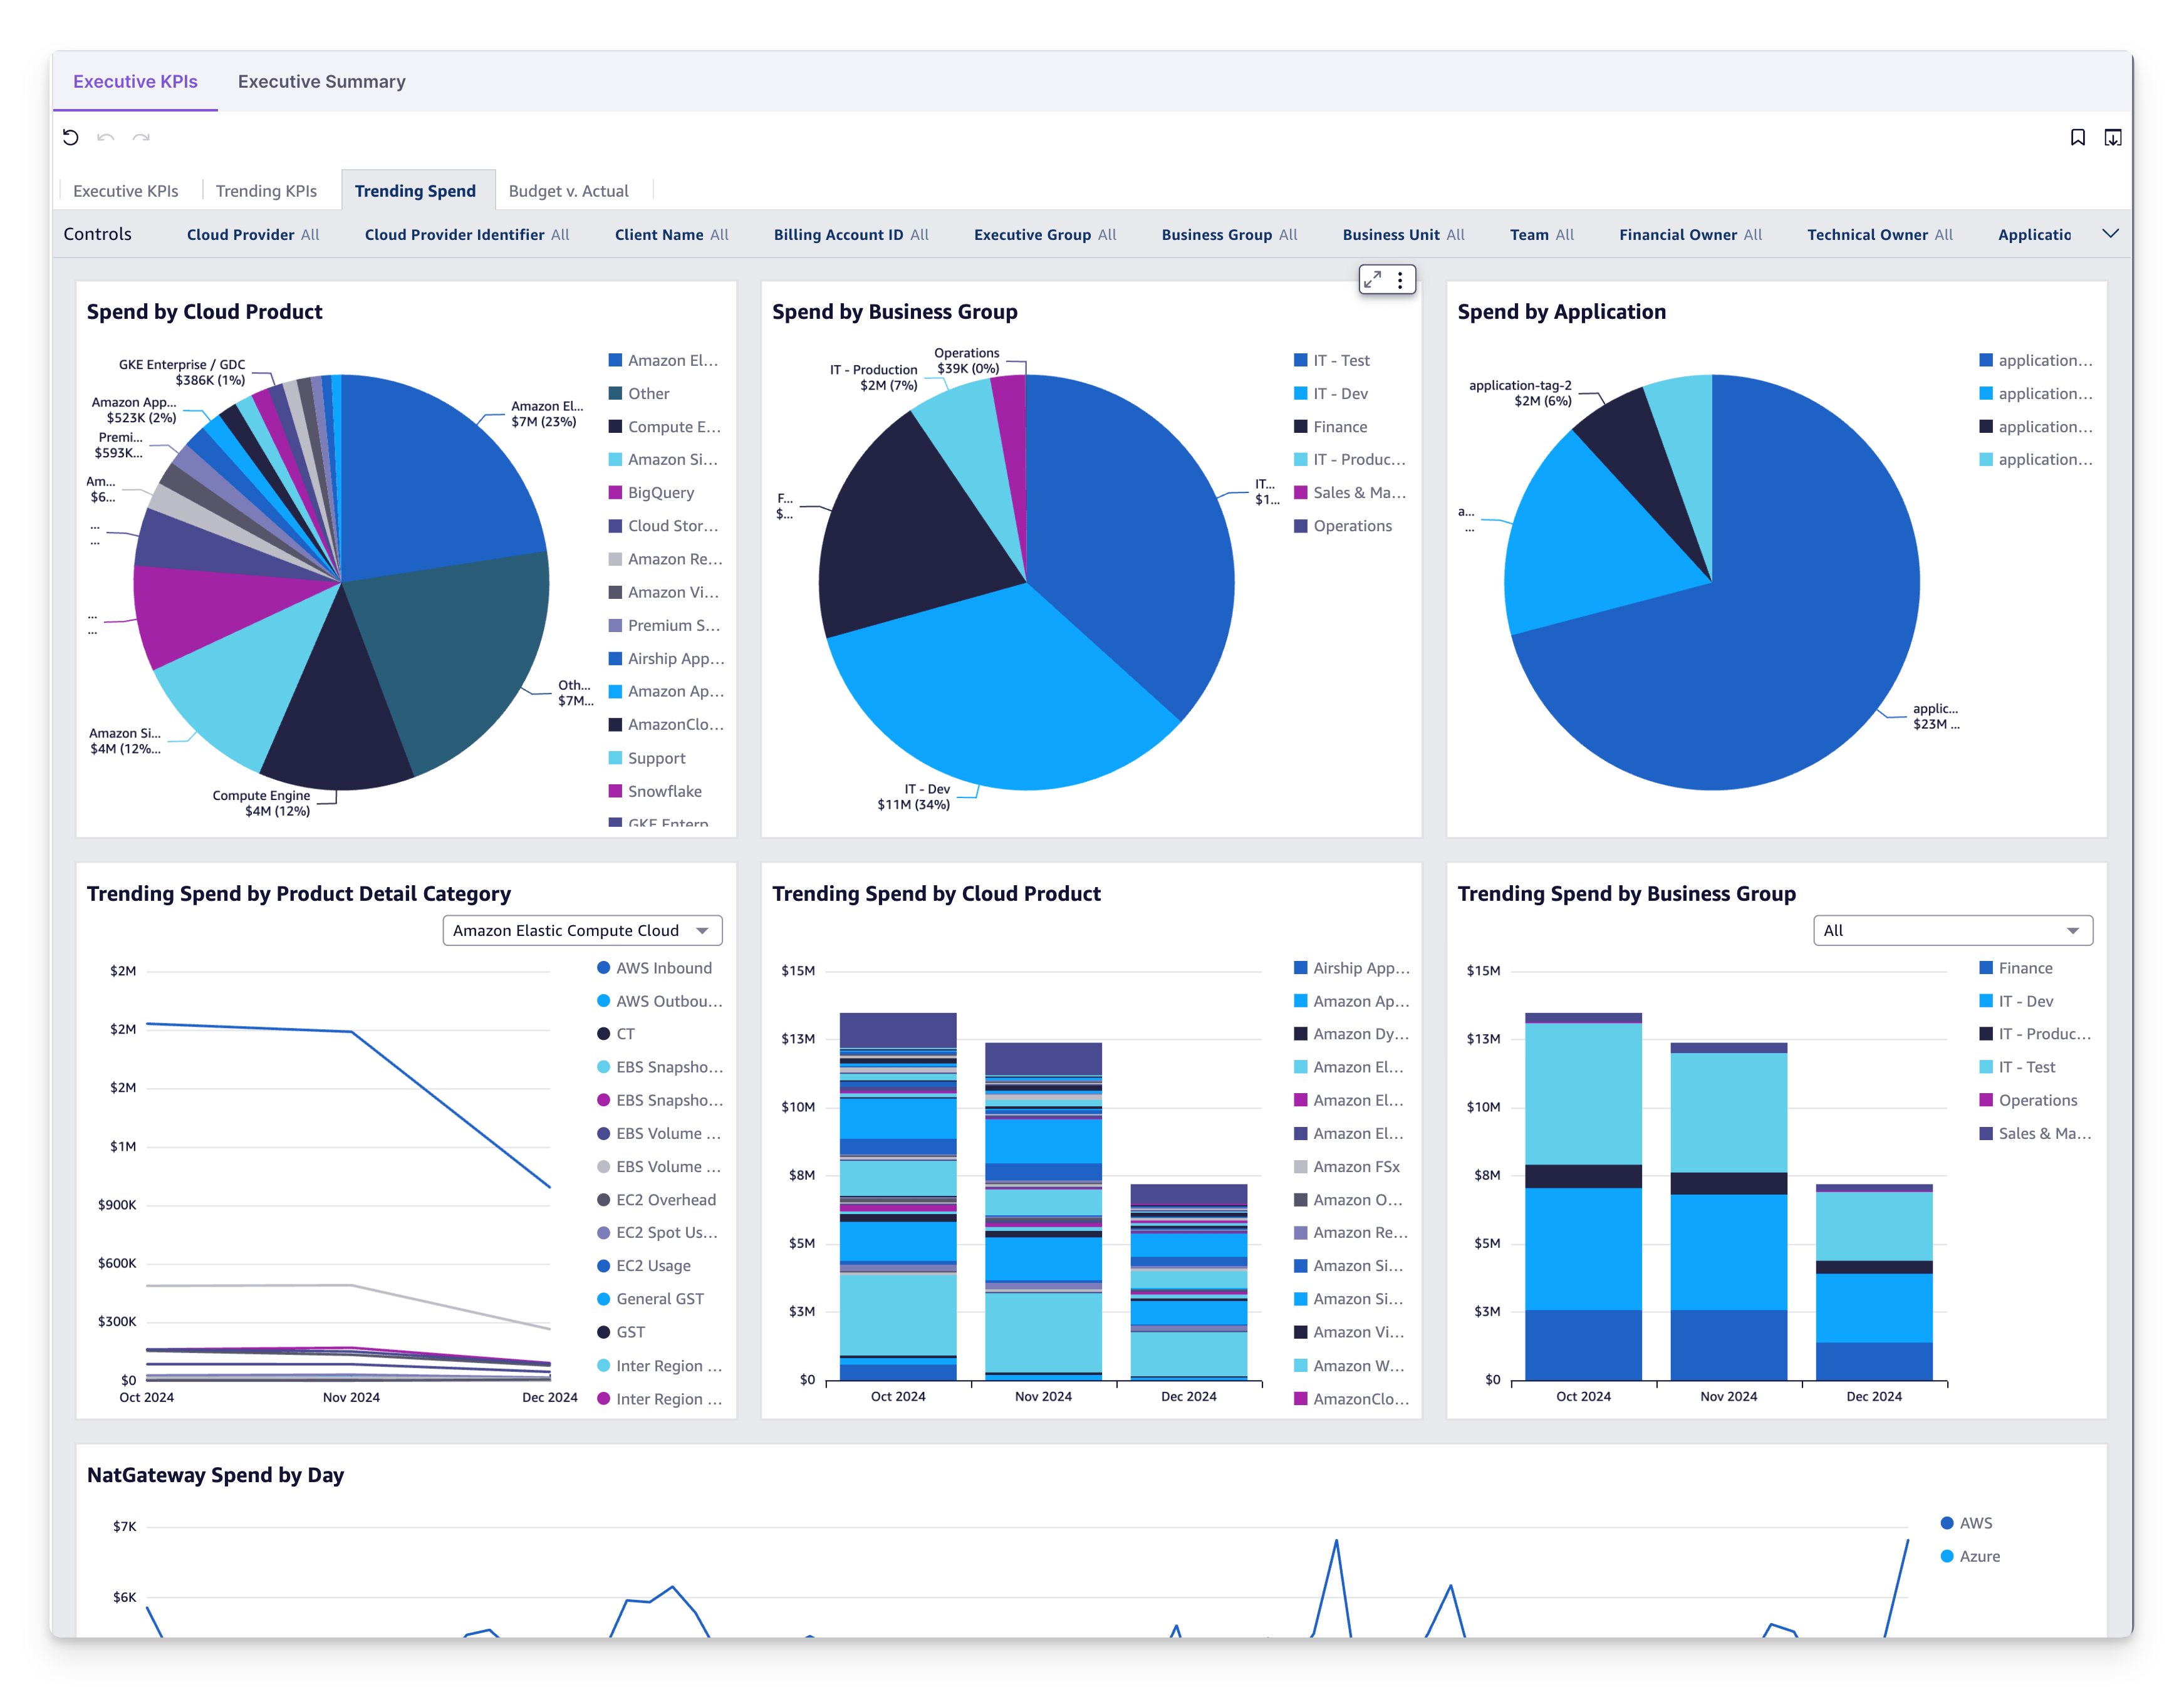
This section offers granular insights into how cloud spend is distributed and changing over time.
- Spend by Cloud Product: Breakdown of costs by specific cloud services.
- Spend by Business Group: Allocation of spend across teams or departments.
- Spend by Application: Application-specific cost distribution.
- Trending Spend by Product Category: Monthly cost trends for compute, storage, and data transfer.
- Daily Spend Analysis: Tracks day-to-day spending for key areas like networking.
How this Enables Your Team
- Track Cost Drivers: Identify the largest contributors to cloud costs.
- Accountability: Allocate spending to teams or departments for better financial management.
- Proactive Monitoring: Detect anomalies in daily spending trends to mitigate unexpected costs.
Budget vs. Actual Tracking

Information on this Dashboard
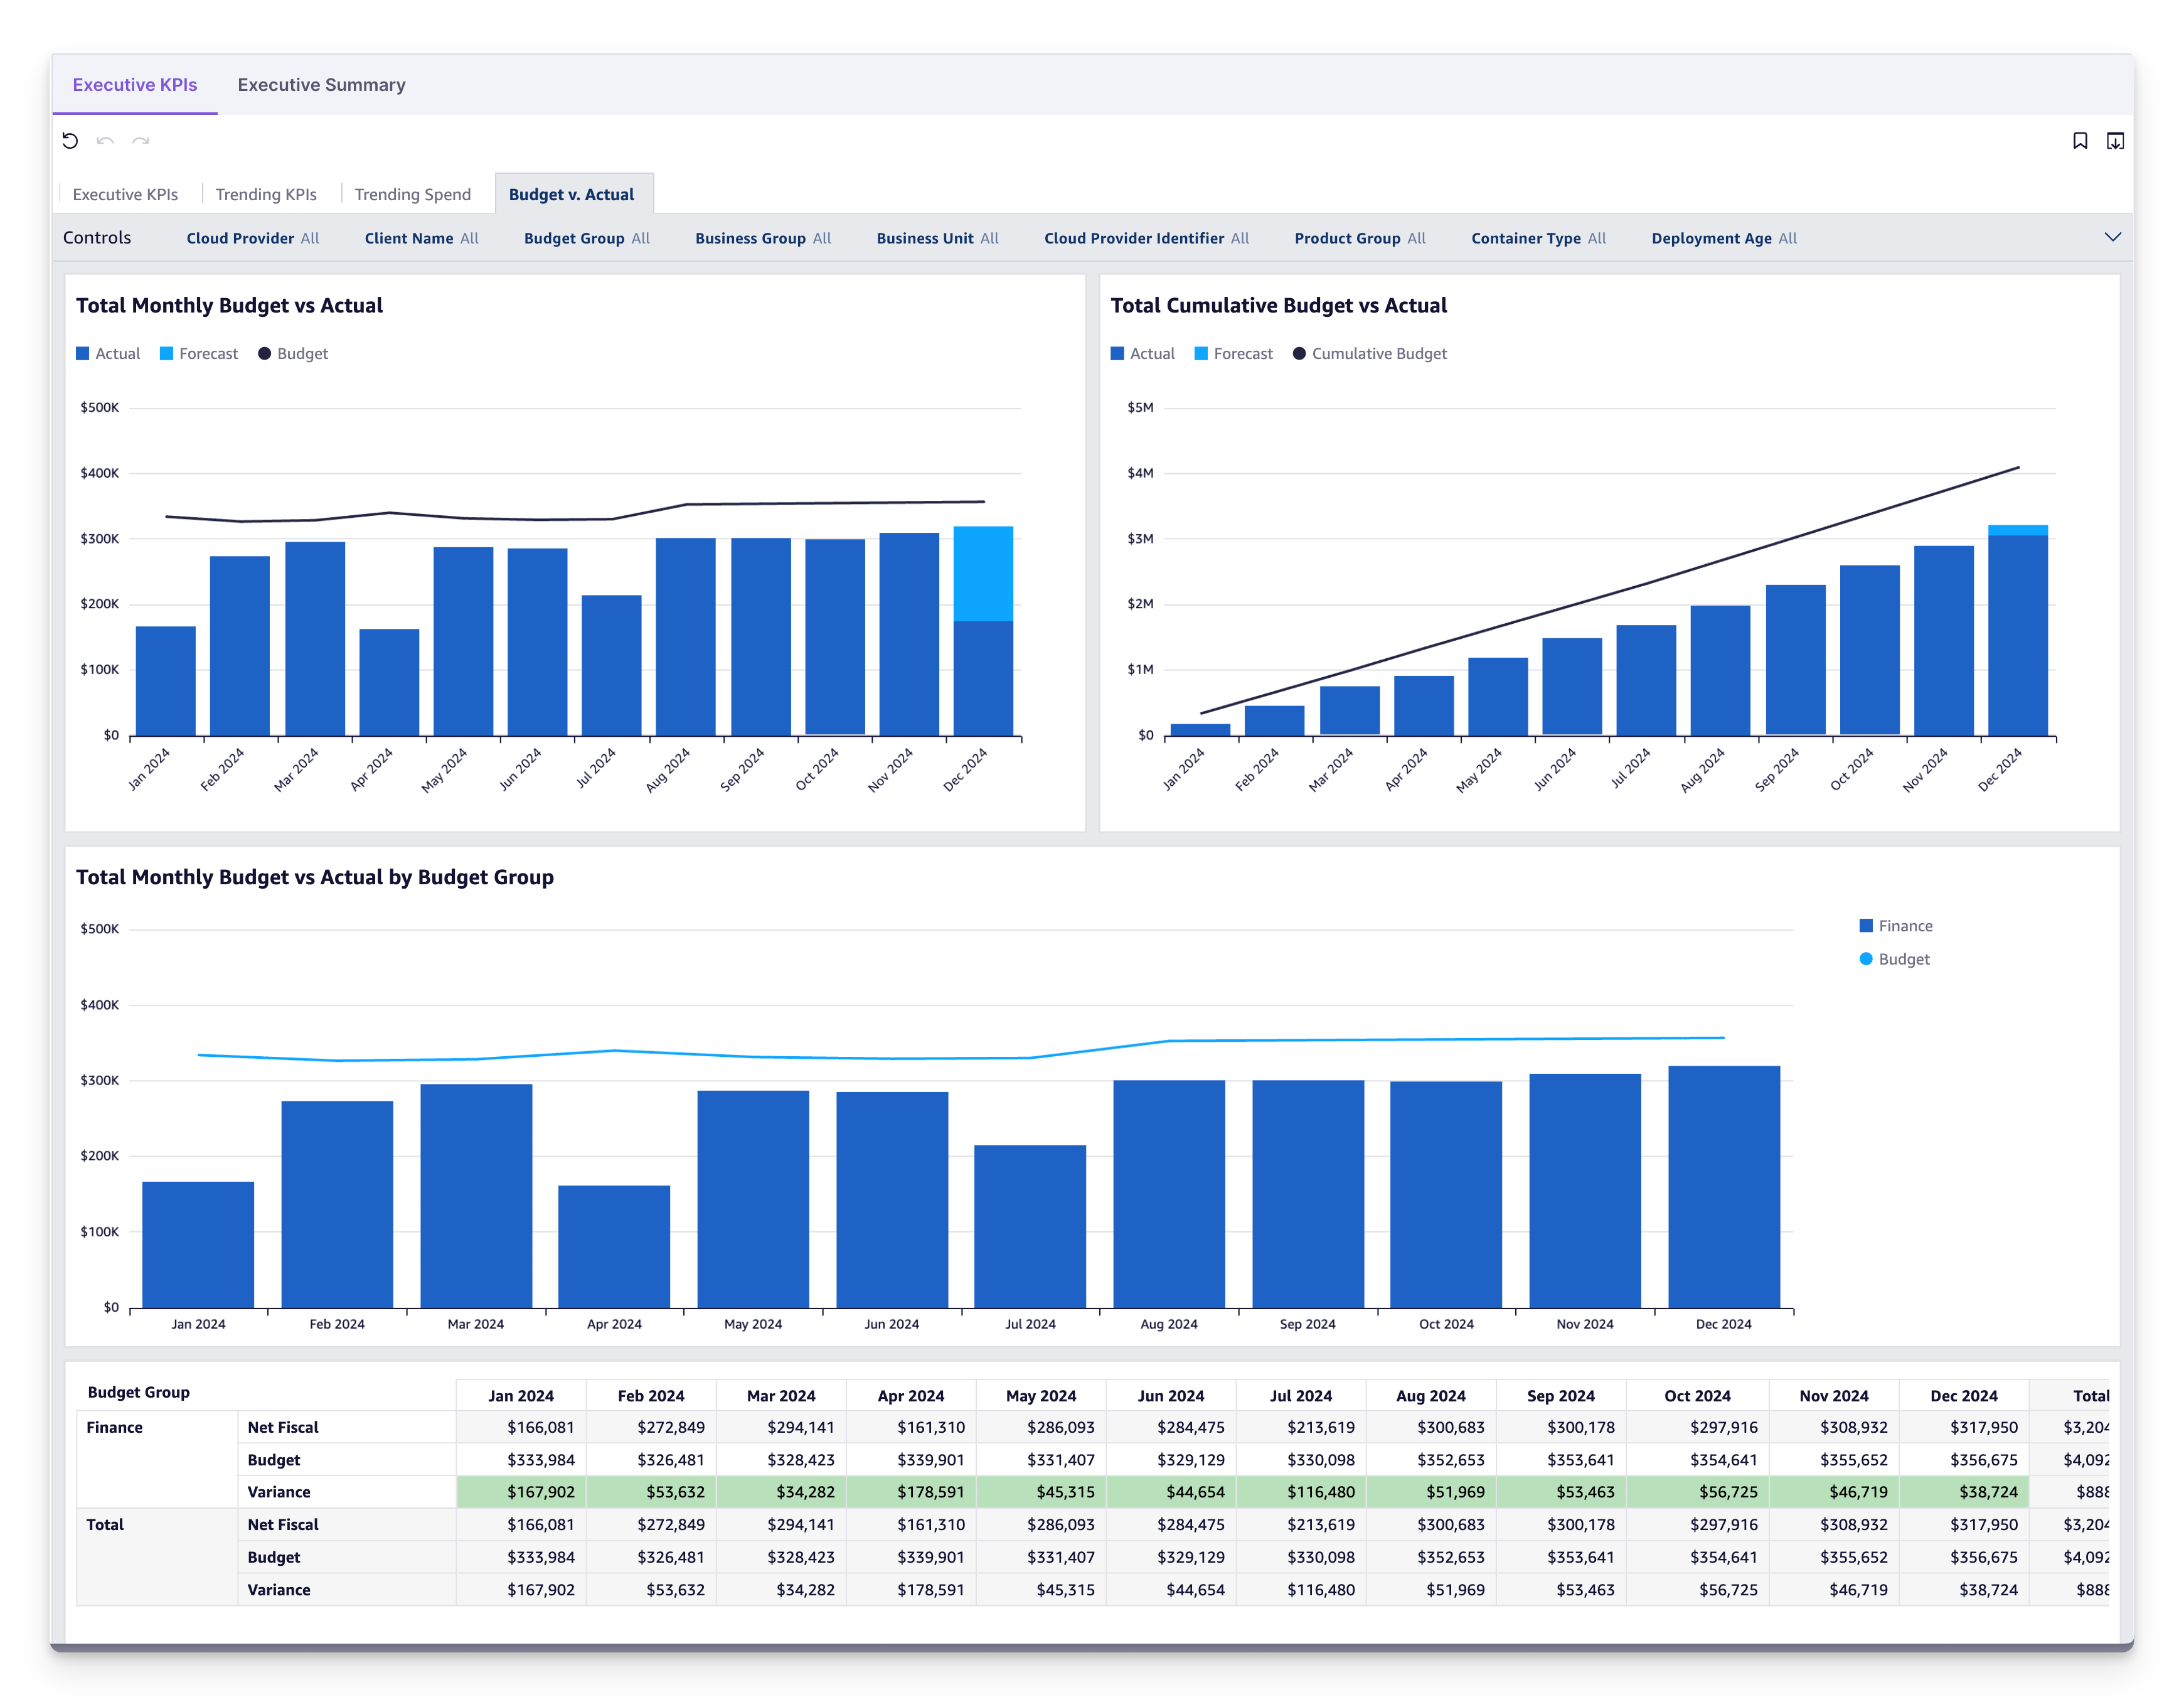
The Budget vs. Actual section provides a view of how actual cloud costs compare to planned budgets.
- Monthly Budget vs. Actual: Tracks real-time spend against planned forecasts.
- Cumulative Budget vs. Actual: Aggregates performance against cumulative targets.
- Variance Analysis: Highlights over- or under-spending across time periods.
How this Enables Your Team
- Improve Budget Accuracy: Identify areas where budgets consistently overrun or underspend.
- Support Cost Control: Use variance insights to adjust spending behaviors or forecast more effectively.
- Guide Financial Decisions: Align cloud costs with organizational goals through better visibility.
Cloud Commitment Tracking
![]()
Information on this Dashboard
The Cloud Commitment Tracking section monitors multi-year cloud agreements to ensure commitments are met efficiently.
- Cumulative Spend Burn-Down: Tracks progress against AWS, Azure, and GCP multi-year commitments.
- Deal Credits and Overages: Monitors applied credits and tracks areas of potential overages.
How this Enables Your Team
- Optimize Agreements: Ensure commitment spending aligns with organizational goals.
- Reduce Risk: Monitor overages or missed opportunities to leverage deal credits.
- Plan Ahead: Use tracking data to negotiate future agreements or refine commitment strategies.
Commitment Detail

Information on this Dashboard
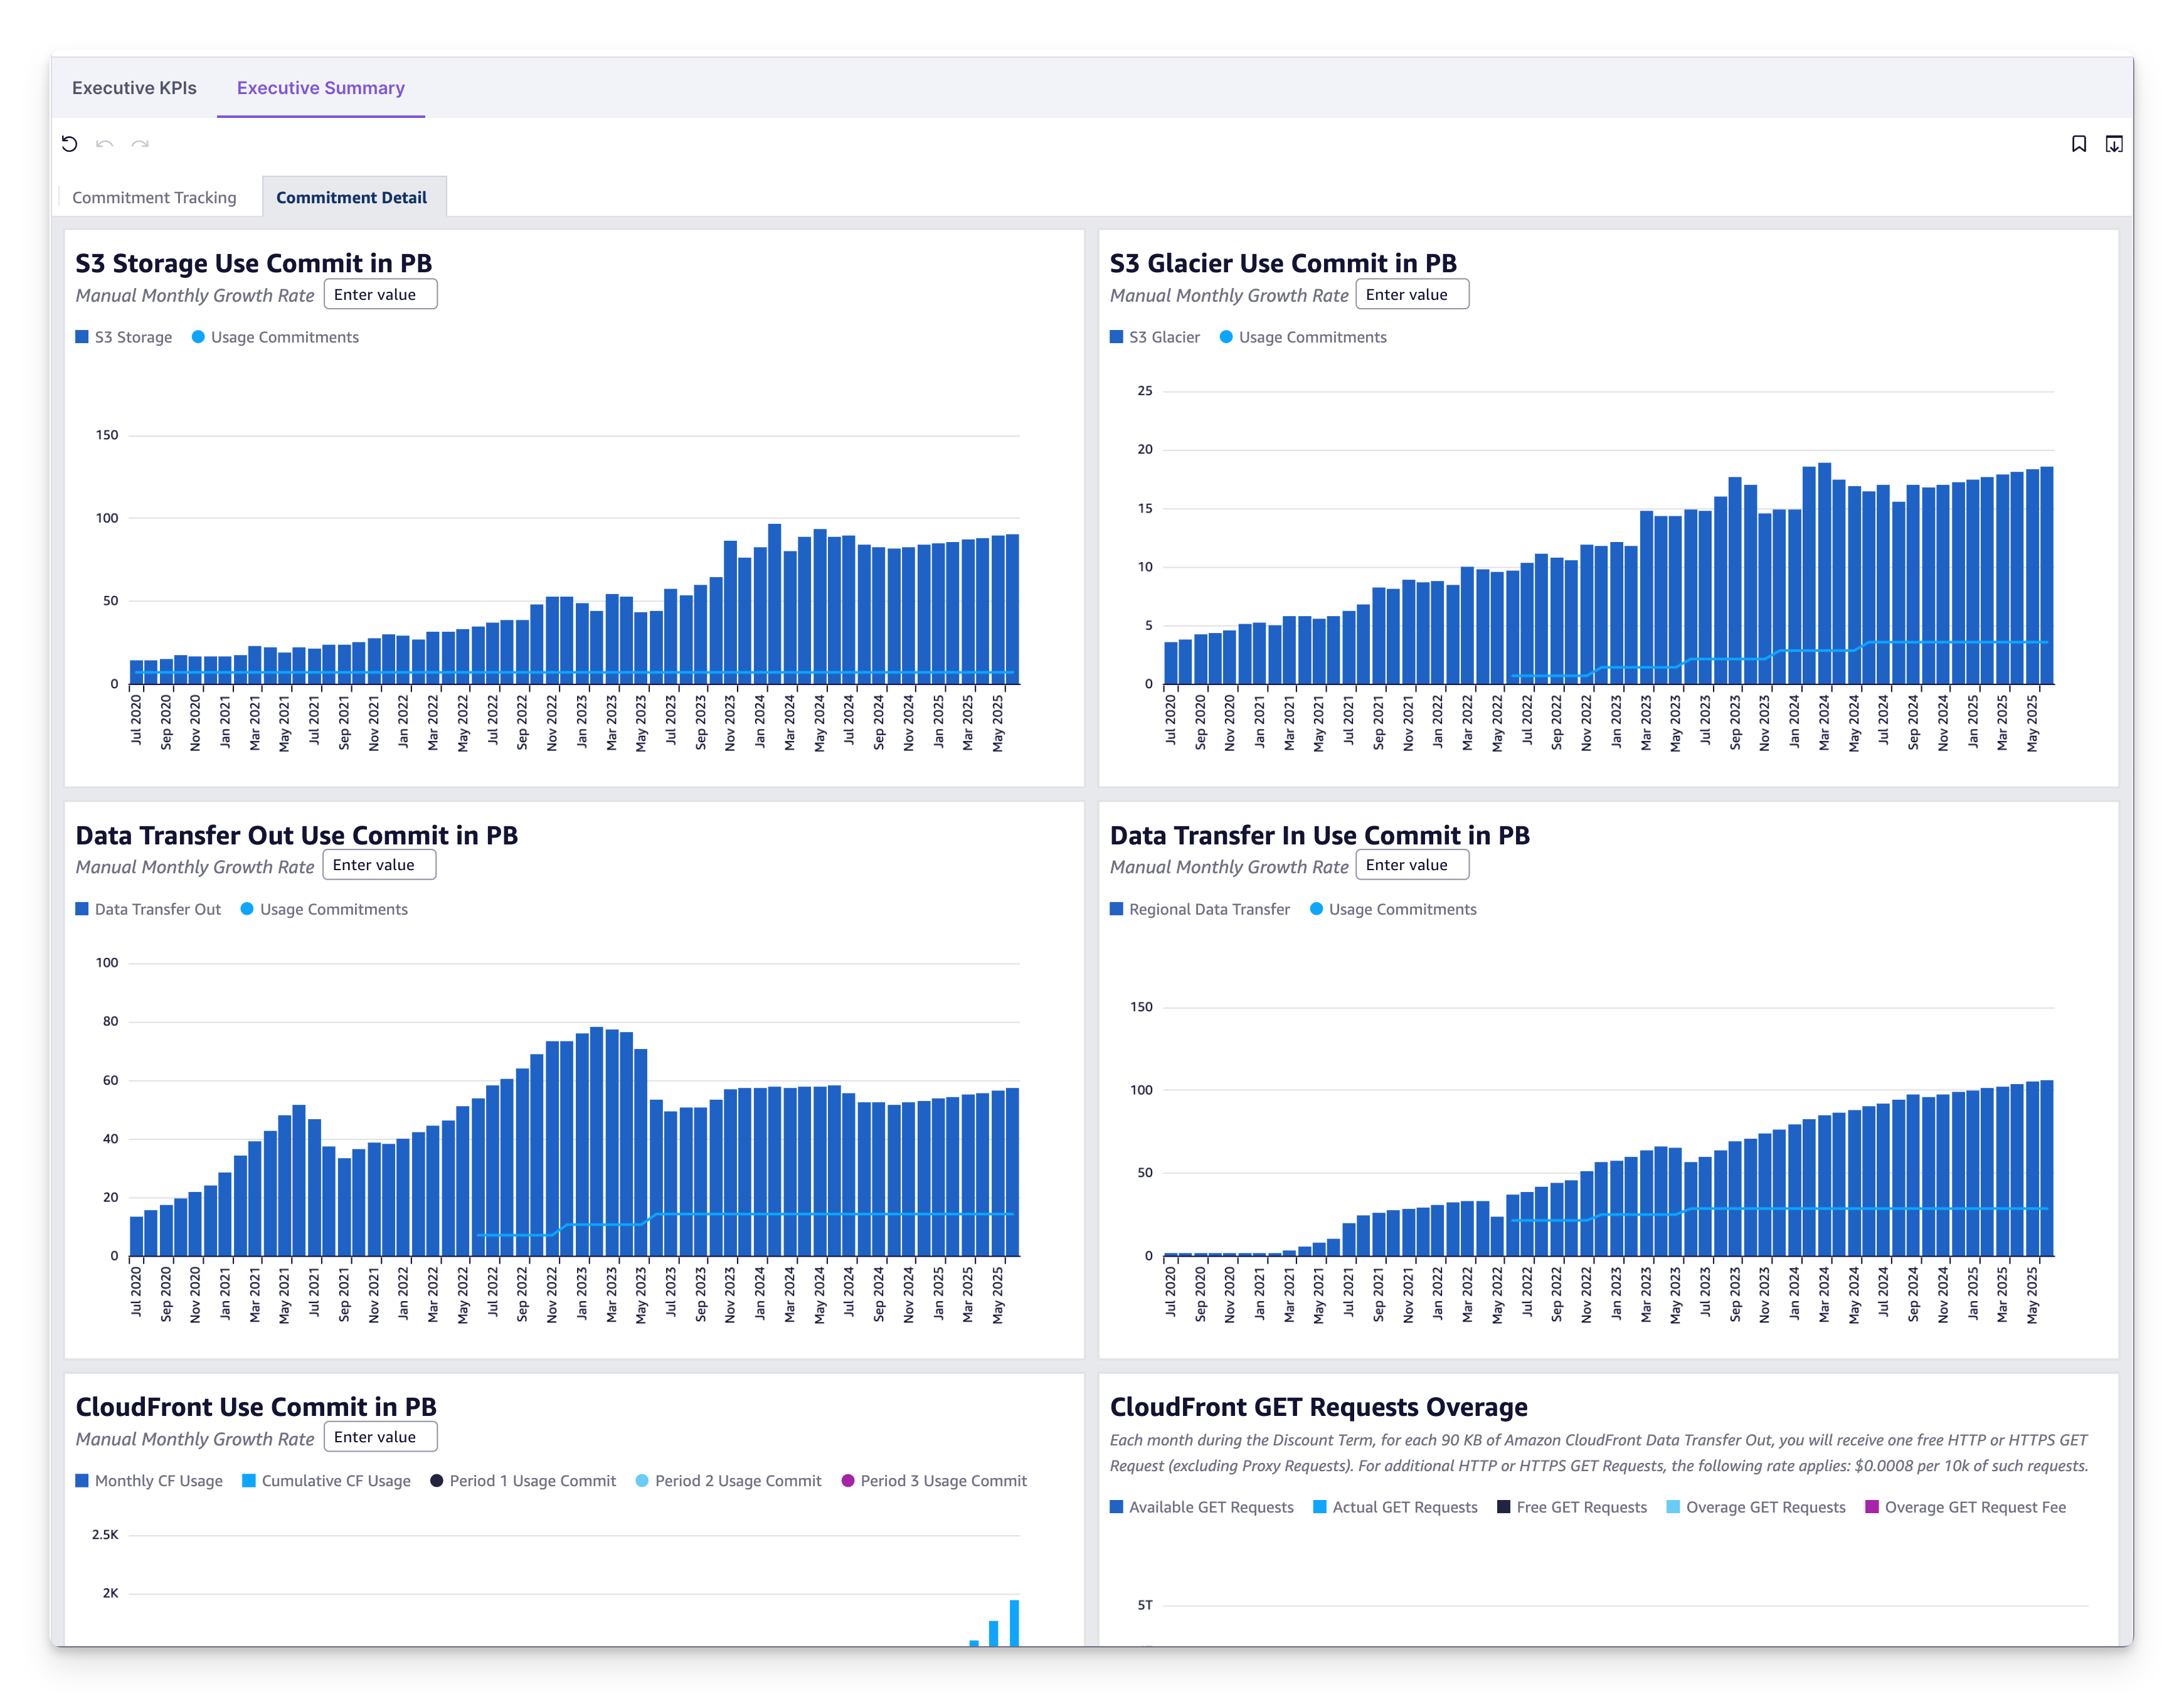
This section dives deeper into specific products and usage commitments, providing granular visibility.
- Product-Level Usage: Tracks usage for cloud products like S3, Glacier, or EC2.
- Growth vs. Commitments: Compares actual consumption to expected growth rates.
- Overage Analysis: Identifies areas where usage exceeds committed amounts.
How this Enables Your Team
- Optimize Usage: Pinpoint inefficiencies in specific cloud product use.
- Proactively Manage Commitments: Adjust strategies to prevent overages or underutilization.
- Inform Purchasing: Use granular insights to refine cloud purchasing strategies.
Customizing KPIs and Dashboards
The Executive KPIs Dashboard is a Vega curated selection of KPIs to help FinOps teams get started quickly. If you want to build your own KPIs and dashboards with customized layouts, Vega provides Dashboard Authoring to allow full customization:
- Add custom KPIs and metrics.
- Adjust visual layouts like bar charts, tables, gauges, and more.
- Filter data to focus on specific teams, business units, or cloud providers.
- Private as well as shared views distributed to your teams
Frequently Asked Questions (FAQ)
How can I evaluate if my savings rates are effective?
A savings rate above 30% is generally considered strong. If your Total Savings Rate is below 10%, investigate whether you're leveraging available negotiated terms and committed-use savings programs. For example, ensure reservations or savings plans align with your workloads.
What does the “Negotiated Savings Rate” tell me?
It indicates the percentage of savings achieved through custom enterprise agreements or private pricing terms. If this rate is low, revisit your agreements to ensure you're maximizing discounts, or consider renegotiating terms with your cloud provider.
Why is “Current Generation Adoption” important?
It shows how many virtual machines are running on the latest instance types. Low adoption rates may indicate missed opportunities to improve performance and cost efficiency, as newer instance types often deliver better value.
How can the “Specialty Types” metric help with failover planning?
Specialty instances may not have the same availability across regions. Monitoring their usage helps ensure you have suitable failover options and reduces risk during regional outages.
What should I do if I see a sudden spike in Daily Spend Analysis?
Investigate workloads for unexpected scaling events, misconfigurations, or unplanned data transfers. Use the filters on the dashboard to drill into the source of the increase for targeted action.
How can I use “Trending Savings by Month” for budgeting?
This feature provides historical savings data that can guide future budget allocations. For instance, a consistent increase in committed-use savings may signal opportunities to expand or adjust these programs to reduce costs further.
Can I track spend across business units or teams?
Yes. The “Spend by Business Group” visualization helps allocate costs by team or department, enabling accountability and improved resource planning.
What if my savings rates don’t match expectations?
If your savings rates are lower than expected, verify that negotiated terms are correctly applied and that workloads are aligned with reserved commitments. Misconfigurations or incorrect discount application by the cloud provider can often lead to discrepancies.
Can I create custom KPIs for my organization?
Yes. Use the Dashboard Authoring feature to build custom KPIs tailored to your organization's goals, such as adding metrics specific to your business units or adjusting targets for savings or usage.